
This email consists of many mini-articles about the coronavirus. Rather than try to make them flow into a story, I’m just going to break them up and let you pick and choose what you want to read.
Table of Contents
Last week’s email (in case you missed it)
The curve this week (and what it means)
Possible caveats of the data (and what they mean)
What Minnesota is doing that actually makes sense (and why)
How COVID-19 differs from the “regular flu” (night and day)
What you can do to avoid the virus (become an OCD hermit)
What you can do to prepare your business for the new normal (whatever that may be)
Last Week’s Email
This is a follow-up email to one I sent a week ago about the coronavirus.
I had noticed that in the US, the number of cases was going up tenfold every 8 days, and that had some serious implications.
If you missed it, you can read it here:
https://www.thenumberscoach.com/covid-19-predictions/
The Curve This Week
This graph shows the number of cases in the US over time. The blue and red squares are actual data points. The green and blue lines show possible trends.
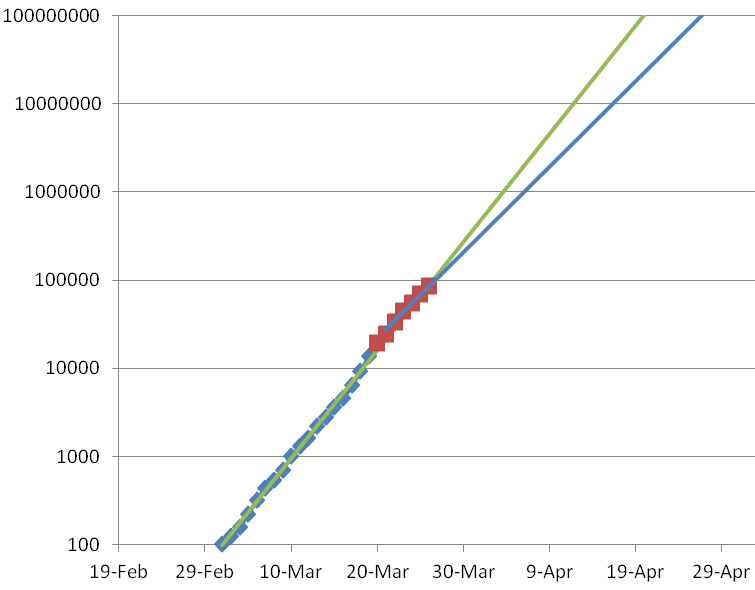
This curve is on a logarithmic scale, so the straight lines you see actually represent the exponential growth of the number of cases.
Last week, I said that if the curve continued as it has, we will hit about 100,000 cases by March 26 (actually 88,000). The actual number of cases on that day was 85,435. So it looks like we haven’t “flattened the curve” much.
The green line represents the trend from March 2 to March 19, the data I had at the time.
The graph seems to be taking a slightly reduced slope now, meaning the virus is not growing as fast. The blue line represents what would happen if this new reduced slope becomes the norm. It’s not much different, but if you look where it crosses the 100 million mark, it does happen four days later, and every day counts.
The green line represents a 10x increase every 8 days. The new blue line represents 10x every 10 days.
Bottom line: If this curve doesn’t flatten, the virus will saturate the US before the end of next month. We’ll see a million cases in a week to 10 days, 10 million a week to ten days after that, and 100 million (pretty much the whole US) within 10 days after that.
Possible Caveats Of The Data
Any time you’re going to use data to make predictions, it is wise to consider where your data came from and how it could be skewed or contaminated.
Oddly, the data source I used changed some of their historical numbers since last week! The changes weren’t significant, but it makes me wonder … how could those numbers change!? Also, I typo’d one number last week, which made a small “bump” in the curve that wasn’t real. All these changes are reflected in the curve above.
The numbers I am using represent the number of reported patients who tested positive for COVID-19.
Many cases of COVID-19 reportedly show no symptoms. So there could be many more people that have COVID-19 and never got tested. That would mean my numbers are low. However, they should be low across the board, so the trend line should still be accurate. Those are assumptions. It is important to know what assumptions you are making, too!
I
have heard that the COVID-19 test used to take up to a week to get
results, but now it takes less time. I have nothing to confirm or deny
that, but it is interesting to think about.
If, in fact, it takes 7 days for test results to come back, then really, my data represents patients from 7 days ago! We are already 7 days further down the line than what the data shows. That would mean that the numbers are already nearly 10 times what the graph shows.
If, in fact, the test results used to take 7 days but now take less time, let’s say 1 day, then the maybe the curve is flatter than what we see. Because at the older end of the curve, it used to take a week to get results back, but at the newer end of the curve, closer to now, it takes only one day. So some portion of the rise in the number of cases may be due to quicker test results.
My gut says this is likely not the case, though. The line on this log scale is so straight! That means the shape of the curve is very nearly an exact exponential function. This is what we would expect if we are looking at a virus beginning to take over a population. If there were a point where quicker test results started coming back, we should see a straight line, then a JUMP, then a straight line again. The straight line portions of the curve would represent the true exponential growth of the virus. The JUMP would represent the curve playing catch-up when the new testing provided quicker results.
This is an interesting case where the data can be used to validate itself!
So there are some possible caveats of the data, but they don’t change what the data says overall. This train is coming and we’d better get ready for it.
What Minnesota Is Doing That Actually Makes Sense
When I first heard the news, I thought it was too little too late.
The governor of Minnesota has issued a stay-at-home order beginning at midnight tonight (Friday, March 28, 2020).
Then I heard a news report that explained the reasoning. It actually makes a lot of sense.
The governor recognizes (as I do) that this thing is coming and coming fast and there is no avoiding that.
It is predicted that the peak in the curve in Minnesota is going to come in early May. The number of cases requiring Intensive Care Units (ICU’s) vastly exceeds our capacity. Hospitals are laboring to create more ICU space but they won’t make it by May 1.
The purpose of the stay-at-home order is to slow the virus just enough that it won’t peak until June. That would give the hospitals enough time to create the necessary ICU space to handle the peak.
That’s actually pretty sophisticated thought process and makes a lot of sense to me.
There’s no false optimism. It’s going to be horrific, but at least we’ll be able to handle the horror and give our citizens a fighting chance.
How COVID-19 Differs From The “Regular Flu”
This information is summarized from this excellent article:
TRANSMISSION
Typical flu is most contagious 3-4 days after you start showing symptoms. COVID-19 is contagious (some sources say MOST contagious) before you show symptoms. So people who feel fine and think they are well are actually spreading the disease.
Typical flu patient spreads the virus to 1.3 others on average. COVID-19 patients spread it to 2 to 2.5 people.
COVID-19 can be transmitted by cough, sneeze or just breath! This is the reason for the six foot rule. Also, it can be transmitted by anything a person touches. Consider who puts product on shelves, take-out in bags, the money you get back from the store … these could all be sources of the virus.
DEGREE OF ILLNESS
Typical flu puts about 1 – 2 % of cases in the hospital.
COVID-19 puts about 20% of cases in the hospital.
LENGTH OF HOSPITALIZATION
Typical flu patients that are hospitalized are out in 5 or 6 days.
COVID-19flu patients typically require 11 days. Twice as long!
No wonder there is so much concern about hospital bed space.
PERCENT OF POPULATION WHO ARE LIKELY TO GET IT
Typical flu in a typical year infects about 8% of the population. Perhaps up to 20%.
Since no one has immunity, experts say COVID-19may infect up to 80% of Americans.
DEATH RATE
Typical flu kills about 0.1% of those who get it. (one in 1000)
COVID-19 is currently estimated to kill 1%. (one in 100)
What You Can Do To Avoid The Virus
Become an OCD hermit.
No, seriously, if you are out in public and not washing and disinfecting like Howie Mandel on crack cocaine, you are going to get the disease.
As for myself and my family, I’m not too concerned. We don’t have any of the risk factors that would likely make it deadly for us. I’m not looking forward to it, but I’m not scared enough to do what it would take to try to totally avoid the virus.
By the way, risk factors include
- age (over 60 and you are higher risk. more than that, more risk)
- obesity
- any respiratory illness (asthma, etc)
- any heart condition
- any with weak immune systems (for example, cancer patients)
- diabetes
- renal failure
- liver disease
Details here (like you couldn’t Google it)
https://www.cdc.gov/coronavirus/2019-ncov/specific-groups/people-at-higher-risk.html
Here’s my big fat disclaimer: I’m not a medical expert. I’m an engineer. That being said, I’m pretty good at clarity. I know what information is important and what I can disregard. I can read between the lines.
This disease is transmittable by BREATH. So if you’re in the same room with someone who is breathing, you may be at risk. Because they may have the disease and not even know it and be contagious.
This disease is transmittable by TOUCH. So if someone who is contagious touches something, and then you touch it, you may have the virus on your hands. If you then touch your face, it can get in your eyes, nose or mouth and you could get sick.
SO, if you have a high risk factor and don’t want to get COVID-19, I recommend you stay home. Literally don’t leave the house.
Disinfect everything. I mean everything. Be paranoid.
The virus may be there for up to ten days! So be extra careful of anything anyone else may have touched. I’m thinking grocery store items, take-out or delivery food, anything.
If you touch something that someone else may have touched, wash your hands after. Take 20 seconds to do so. Use soap. Soap kills the virus within 20 seconds.
Again, be paranoid. It doesn’t take much virus to get you sick, and if you have high risk factors, just don’t take any chances.
This thing will blow over at some point, and then life can return to normal. But until that happens … actually some time after that happens (like greater than ten days – call it two weeks). Remember, the virus can live on surfaces for that long.
What You Can Do To Prepare Your Business For The New Normal
WORK IT, BABY!
Everything I am seeing so far indicates we will be out of the woods by summer. It’s going to be horrific in the meantime. So much pain and sorrow I can’t even let myself think about it. But the smoke will clear.
Most of us will still be here.
Most people will have jobs.
Most people will have money.
I believe a lot of businesses will not be in aggressive pursuit of new customers.
You should be.
You may not feel like it, but is those that take action quickly when the smoke clears that will win.
In the meantime, I’m hoping and praying for you.
Be well. Do good.